- Climate and extreme events
- Regulation and market
- Transmission
What PDE 2036 reveals about the past decade's surprises and the future of electricity demand, generation, transmission, and climate resilience in Brazil.
Resilion9 min read
AI-generated image
EPE (Brazil's Energy Research Office) released the public consultation version of the PDE 2036 Summary Report (Ten-Year Energy Expansion Plan) in early October. The PDE is Brazil's main energy-sector planning document and deserves careful attention. In today's article, I highlight its key insights for the electricity sector.
<br />I begin by comparing PDE 2036 with the forecasts made ten years ago in PDE 2026 to identify the biggest surprises of the past decade. I then summarize projections for the next ten years and the trends underlying them. Finally, I examine power transmission and climate resilience, a subject that has gained prominence in the plan.
PDE 2036 vs. PDE 2026: what were the surprises?
Forecasting ten years ahead is no easy task. When I compare projections made a decade ago with what actually happened (or, more precisely, with estimates for 2026, a year still underway), I am not judging the technical skills of EPE's highly qualified team. My aim is to highlight unexpected changes—which is why I use the word “surprise,” not “error.”
The biggest surprise, the growth of distributed generation, illustrates the limits of forecasting. In 2016, when Brazil's solar industry was still in its infancy, it was far from obvious that solar system costs would fall so quickly. It was even less obvious that Congress would approve, at the end of 2021, a legal framework for distributed generation that was highly favorable to the sector. This also illustrates a growing challenge for the electricity sector: regulators have less and less control over key decisions, which are increasingly driven by the legislature.
Here is a summary of the main surprises:
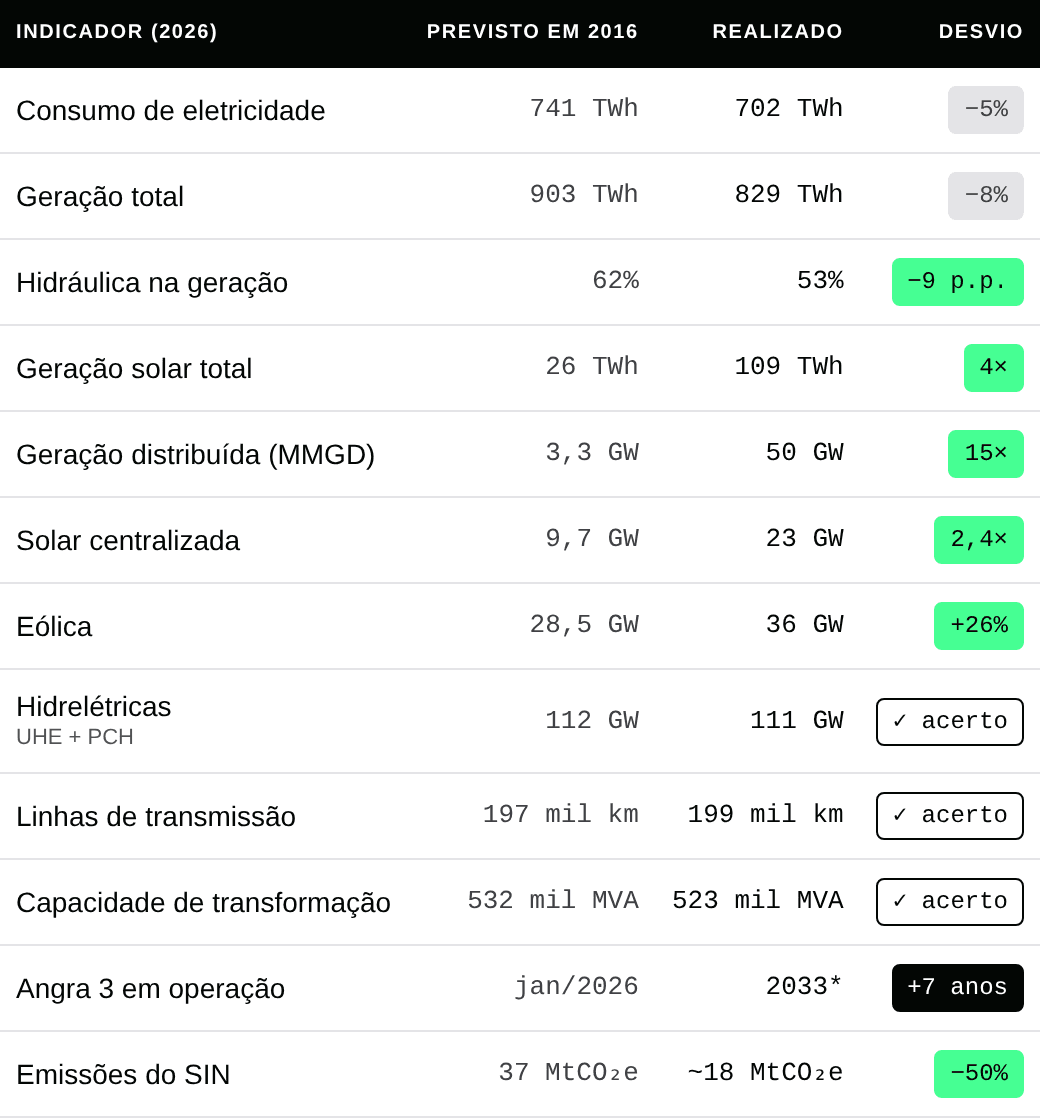
1. Renewables grew far beyond expectations. PDE 2026 forecast 3.3 GW of small-scale distributed generation (MMGD) in 2026. We have reached around 50 GW, fifteen times more. Combining utility-scale and distributed generation, wind and solar already account for 28% of generation, almost twice the expected share, while hydropower fell to 53% (against a projected 62%). As a result, emissions from the interconnected power system were about half the forecast level.
2. We moved from scarcity to oversupply. In 2016, the concern was ensuring adequate energy supply. Today, electricity is abundant during sunny hours, and generation cuts (known as curtailment)—a topic not even mentioned in PDE 2026—have become one of the sector's most debated issues. At the same time, securing enough capacity to meet demand in the early evening, when the sun sets, has become one of the main operational challenges.
3. Consumption and generation fell short of expectations. Electricity consumption was 5% below projections, and generation was 8% lower. The explanation lies outside the sector: GDP grew 0.5 percentage points per year less than expected, and the 2022 Census revealed a population about five million smaller than projected.
4. EPE forecast transmission expansion with remarkable accuracy. Transmission line length and substation capacity came within 2% of forecasts. This is no coincidence: transmission is planned years in advance, and its expansion is fully controlled by regulators through auctions.
What PDE 2026 forecast, and what happened
Surprise · Accurate (±2%) · Below forecast · Delay
Sources: EPE/MME, PDE 2026 (Dec. 2016) and PDE 2036, Summary Report (Oct. 2026, public consultation version). Figures for 2026 are PDE 2036 estimates. Capacity forecasts in PDE 2026 refer to the National Interconnected System (SIN), excluding self-generation. *Date used in PDE 2036, subject to a decision by CNPE.
PDE 2026 forecasts for 2026 compared with PDE 2036 estimates for that same year.
PDE 2036: what lies ahead
For the next ten years, I highlight seven trends in the plan:
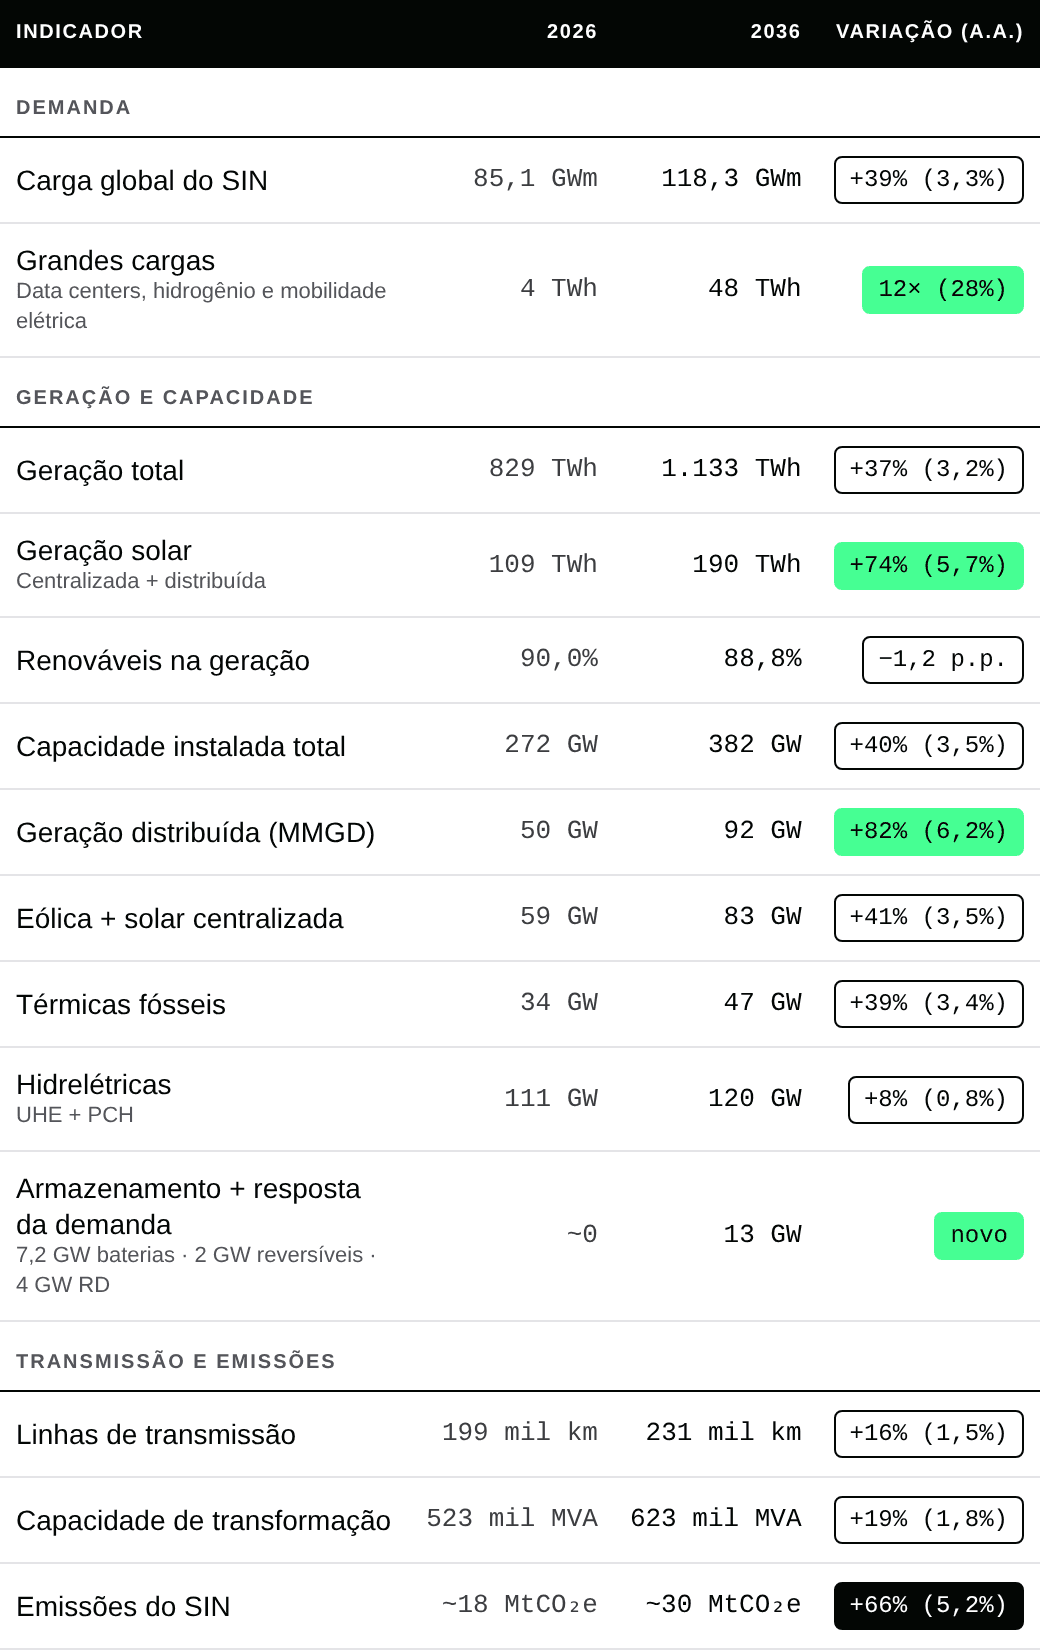
1. Demand keeps growing faster than the economy. The PDE forecasts system load growth of 3.3% per year through 2036, compared with projected GDP growth of 2.5% per year. Electricity's share of Brazil's total energy consumption rises from 20% to 23%. Three factors explain this trend:
- Greater use of air conditioning, which increases commercial and residential consumption and pushes peak demand toward summer afternoons;
- Economic electrification, especially transport;
- New energy-intensive loads, particularly data centers.
2. Large loads are the decade's new development. Data centers, hydrogen plants, and electric vehicles are expected to rise from 4 to 47 TWh per year, equivalent to around 5,400 average MW, or 5% of Brazil's entire electricity consumption in 2036. Data centers alone jump from 3 to 30 TWh, a tenfold increase. These loads are continuous, concentrated, and require very high reliability. The Southeast should attract most new data centers, but the Northeast could receive nearly 30%, thanks to submarine fiber-optic cables and abundant renewable power.
3. Distributed generation leads capacity growth. Of the 110 GW to be added by 2036, 41 GW will come from MMGD plants, taking the segment to 92 GW and nearly 11% of generation. Because solar produces only during daylight hours, its share in energy terms is smaller: MMGD accounts for just under one-fifth of additional generation. The gradual withdrawal of benefits under Law 14,300 slows growth but does not reverse recent trends. Expansion of large wind and solar farms, meanwhile, decelerates precisely because of oversupply and curtailment.
4. The priority shifts from energy to capacity. This is the plan's most important conceptual change. With abundant solar power, electricity is plentiful at midday but scarce in the early evening. The planned expansion therefore rests on two pillars:
- +11 GW of fossil-fuel thermal capacity. Nearly all this expansion was already contracted in the March 2026 Capacity Reserve Auction. Beyond contracted projects, the plan includes just 2.8 GW, half of it from retrofitting existing plants.
- +13 GW of storage and demand response. This comprises 7.2 GW of batteries starting in 2028, 2 GW of pumped-storage hydropower starting in 2035, and 4 GW of consumers paid to reduce demand at critical moments.
Even so, the PDE projects that generation curtailment will remain at roughly the same scale observed in 2026 throughout the decade. In other words, the problem becomes less significant in relative terms as demand grows, but it does not disappear.
5. Hydropower: limited growth and a new role. Hydropower capacity grows by only 8%, around 9 GW, driven by small hydropower plants (4.7 GW) and already-contracted expansions of existing plants (2.9 GW). There are only two new large plants (768 MW), plus 820 MW from modernization. Pumped-storage projects are accounted for separately as storage.
6. Transmission expands moderately, but faces new challenges. The grid is expected to grow 16% in line length and 19% in transformer capacity, slower than load growth. I return to this point below.
7. The power mix stays clean, but emissions rise. Renewables' share of electricity generation slips only slightly, from 90.0% to 88.8%. Emissions from the interconnected system, however, are expected to rise 66%, from about 18 to 30 million tonnes of CO₂ equivalent, due to higher demand and gas-fired thermal generation used to meet peak capacity needs.
Brazil's electricity sector, 2026–2036
Growth above 5% per year or new · Other · Emissions increase
Source: EPE/MME, PDE 2036, Summary Report (Oct. 2026, public consultation version), Reference Scenario. Values for 2026 are estimates. Installed capacity includes centralized generation, isolated systems, MMGD, and self-generation. SIN emissions for 2026 are derived from the reported 66% growth.
Main electricity-sector indicators in the PDE 2036 Reference Scenario.
Transmission: more than new power lines
PDE 2036 forecasts BRL 127 billion in transmission investments through 2036, with 32,000 km of new lines and an additional 100,000 MVA of transformer capacity. More interesting than the numbers, however, are the reasons behind the projects. Three stand out:
- Carrying renewable energy to where it is needed. The main project is Northeast Bipole II, a high-voltage direct-current link that will increase the Northeast's ability to export electricity to the Southeast and South. It will use VSC technology for the first time in Brazil, helping stabilize a grid with extensive wind and solar generation and reduce curtailment.
- Connecting large loads. Several recent studies address grid upgrades in São Paulo, where data centers are concentrated, and the supply of new loads in the Northeast, Center-West, and Pará.
- Getting more from the existing grid. EPE now considers technologies that increase line capacity without building new infrastructure. One example is dynamic line rating (DLR), which uses sensors and weather data to calculate in real time how much power each line can carry. According to the plan, this capacity is usually 10% to 30% above the static limit, with deployment in about 14 months versus several years for a new line.
Resilience: climate enters the planning process
One of PDE 2036's most meaningful changes compared with previous plans is the attention paid to climate. The plan acknowledges that the very feature making Brazil's electricity mix so clean—its reliance on rain, wind, and sun—also exposes it to greater climate variability. Prolonged droughts, heavy rainfall, severe winds, and heat waves can affect demand, generation, and the infrastructure itself, spread across the country. The term “extreme events” also appears, despite not being mentioned at all in PDE 2026.
For transmission, the PDE says climate resilience has become a priority and planning now includes assessments of network vulnerability, risk, and recovery. Examples include the review of transmission projects in Porto Alegre after the 2024 floods and EPE's 2026 Roadmap for Strengthening Electricity Sector Resilience.
This is significant progress. Nevertheless, planning still looks at the system as a whole: where to reinforce it and which interconnections to build. The resilience of each individual line and tower depends on another layer of information: identifying which assets face the greatest exposure to each hazard and where to invest first. As discussed in earlier articles, much of the adaptation work at this level remains to be done.
Conclusion
Looking back, the past decade showed that the electricity sector changed faster than plans could anticipate, especially when decisions were dispersed across millions of consumers and investors. Looking ahead, PDE 2036 points to a different challenge: it is no longer simply about producing enough energy, but about delivering it at the right time and place, with a grid prepared for larger loads and more extreme weather.
If the next ten years resemble the last ten, some of these projections will surprise us too. The best preparation is to monitor what might change and carefully weigh the risks. Those who recognize risks early make better decisions.
Sources: EPE/MME, PDE 2026 (2017), and PDE 2036: Summary Report, public consultation version (October 2026).